涓滴之水终可以磨损大石,不是由于它力量强大,而是由于昼夜不舍的滴坠。
简介
所有的监控的 agent 底层最终都是查询的 /proc 和 /sys 里的信息推送(如果错了轻喷),因为收集宿主机信息方面也想用 pod 跑,会面临到问题
常见的 zabbix_agent 默认读取 fs 的 /proc 和 /sys ,容器跑 agent 会导致读取的不是宿主机的/proc 和 /sys
而 prometheus 的 node-exporter 有选项 --path.procfs 和 --path.sysfs 来指定从这俩选项的值的proc和sys读取,容器跑 node-exporter 只需要挂载宿主机的 /proc和/sys 到容器fs的某个路径挂载属性设置为 readonly 后用这两个选项指定即可,zabbix4.0 看了文档和容器都找不到类似选项应该不支持
虽说上 prometheus 但是 k8s 监控这方面,经常看到如下问题:
- 如何部署
- 用
prometheus的话pod ip会变咋办之类的 - 我的
target怎么是0/0 - 官方
yaml怎么用 operator和传统的prometheus有啥差异operator相对手动部署的prometheus有啥优秀之处- …..
上面问题里大多都是对 prometheus-operator 不了解的,也就是说大多不看官方文档的,这里我举几个例子介绍说说怎样部署 prometheus-operator ,和一些常见的坑
另外网上大多是 helm 部署的以及管理组件是二进制下有几个target 是 0/0 发现不了的解决办法
需要看懂本文要具备一下知识点
svc实现原理和会应用以及svc和endpoint关系- 了解
prometheus(不是operator的)工作机制 - 知道什么是
metrics(不过有了prometheus-operator似乎不是必须)
速补基础
什么是metrics
前面知识点第一条都考虑到k8s集群监控了想必都会了,第二条因为有operator的存在不太关心底层可能不太急需可以后面去稍微学学,第三条无论etcd还是k8s的管理组件基本都有metrics端口
这里来介绍啥什么是metrics
例如我们要查看etcd的metrics,先查看etcd的运行参数找到相关的值,这里我是所有参数写在一个yml文件里,非yml自行查看systemd文件或者运行参数找到相关参数和值即可
1 | [root@k8s-m1 ~]# ps aux | grep -P '/etc[d] ' |
我们需要两部分信息
1 | https://172.16.0.2:2379 |
然后使用下面的curl,带上各自证书路径访问https的url执行
1 | curl --cacert /etc/etcd/ssl/etcd-ca.pem --cert /etc/etcd/ssl/etcd.pem --key /etc/etcd/ssl/etcd-key.pem https://172.16.0.2:2379/metrics |
我们会看到etcd的metrics输出信息如下
1 | .... |
同理kube-apiserver也有metrics信息
1 | $ kubectl get --raw /metrics |
这种就是prometheus的定义的metrics格式规范,缺省是在http(s)的url的/metrics输出
而metrics要么程序定义输出(模块或者自定义开发),要么用官方的各种exporter(node-exporter,mysqld-exporter,memcached_exporter…)采集要监控的信息占用一个web端口然后输出成metrics格式的信息,prometheus server去收集各个target的metrics存储起来(tsdb)
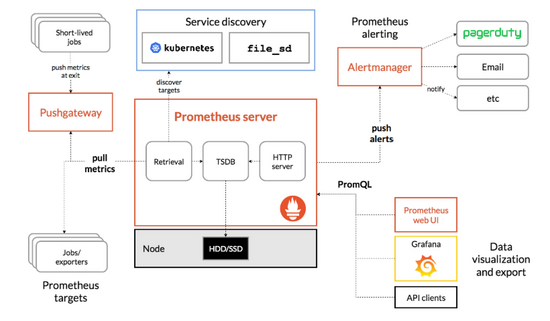
用户可以在prometheus的http页面上用promQL(prometheus的查询语言)或者(grafana数据来源就是用)api去查询一些信息,也可以利用pushgateway去统一采集然后prometheus从pushgateway采集(所以pushgateway类似于zabbix的proxy),prometheus的工作架构如下图
为什么需要prometheus-operator
因为是prometheus主动去拉取的,所以在k8s里pod因为调度的原因导致pod的ip会发生变化,人工不可能去维持,自动发现有基于DNS的,但是新增还是有点麻烦
Prometheus-operator的本职就是一组用户自定义的CRD资源以及Controller的实现,Prometheus Operator这个controller有RBAC权限下去负责监听这些自定义资源的变化,并且根据这些资源的定义自动化的完成如Prometheus Server自身以及配置的自动化管理工作
在Kubernetes中我们使用Deployment、DamenSet,StatefulSet来管理应用Workload,使用Service,Ingress来管理应用的访问方式,使用ConfigMap和Secret来管理应用配置。我们在集群中对这些资源的创建,更新,删除的动作都会被转换为事件(Event),Kubernetes的Controller Manager负责监听这些事件并触发相应的任务来满足用户的期望。这种方式我们成为声明式,用户只需要关心应用程序的最终状态,其它的都通过Kubernetes来帮助我们完成,通过这种方式可以大大简化应用的配置管理复杂度。
而除了这些原生的Resource资源以外,Kubernetes还允许用户添加自己的自定义资源(Custom Resource)。并且通过实现自定义Controller来实现对Kubernetes的扩展,不需要用户去二次开发k8s也能达到给k8s添加功能和对象
因为svc的负载均衡,所以在K8S里监控metrics基本最小单位都是一个svc背后的pod为target,所以prometheus-operator创建了对应的CRD: kind: ServiceMonitor ,创建的 ServiceMonitor 里声明需要监控选中的svc的label以及metrics的url路径的和namespaces即可
prometheus-operator 架构
工作架构如下:
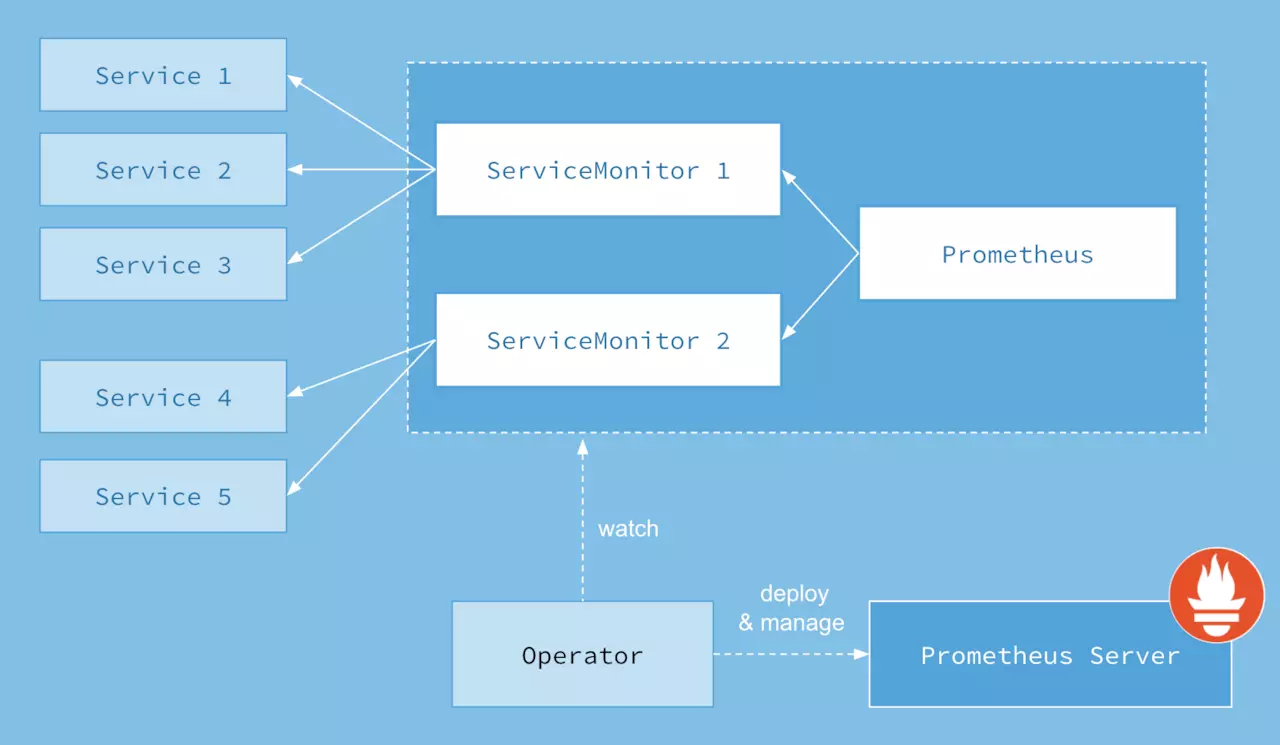
上面架构图中,各组件以不同的方式运行在 Kubernetes 集群中:
Operator: 即
Prometheus Operator,在Kubernetes中以Deployment运行。其职责是部署和管理Prometheus Server,根据 ServiceMonitor 动态更新Prometheus Server的监控对象。Prometheus:声明
Prometheus deployment期望的状态,Operator 确保这个deployment运行时一直与定义保持一致。Prometheus Server: Operator 根据自定义资源
Prometheus类型中定义的内容而部署的 Prometheus Server 集群,这些自定义资源可以看作是用来管理Prometheus Server集群的StatefulSets资源。ServiceMonitor:Operator 能够动态更新
Prometheus的 Target 列表,ServiceMonitor就是 Target 的抽象。比如想监控Kubernetes Scheduler,用户可以创建一个与Scheduler Service相映射的ServiceMonitor对象。Operator 则会发现这个新的ServiceMonitor,并将 Scheduler 的Target添加到 Prometheus 的监控列表中。ServiceMonitor也是 Prometheus Operator 专门开发的一种Kubernetes定制化资源类型。Service:这里的 Service 就是
Cluster中的Service资源,也是Prometheus要监控的对象,在Prometheus中叫做Target。每个监控对象都有一个对应的Service。比如要监控Kubernetes Scheduler,就得有一个与 Scheduler 对应的Service。当然,Kubernetes集群默认是没有这个Service的,Prometheus Operator 会负责创建。Alertmanager:定义
AlertManager deployment期望的状态,Operator确保这个deployment运行时一直与定义保持一致。
Operator是最核心的部分,作为一个控制器,他会去创建Prometheus、PodMonitor、ServiceMonitor、AlertManager以及PrometheusRule等CRD资源对象,然后会一直监控并维持资源对象的状态。
其中创建的Prometheus这种资源对象就是作为Prometheus Server存在,而PodMonitor和ServiceMonitor就是exporter的各种抽象,是用来提供专门提供metrics数据接口的工具,Prometheus就是通过PodMonitor和ServiceMonitor提供的metrics数据接口去pull数据的,当然alertmanager这种资源对象就是对应的AlertManager的抽象,而PrometheusRule是用来被Prometheus实例使用的报警规则文件。
这样我们要在集群中监控什么数据,就变成了直接去操作 Kubernetes 集群的资源对象了,是不是方便很多了。上图中的 Service 和 ServiceMonitor 都是 Kubernetes 的资源,一个 ServiceMonitor 可以通过 labelSelector 的方式去匹配一类 Service,Prometheus 也可以通过 labelSelector 去匹配多个ServiceMonitor。
自定义资源
在最新的社区部署方式中,kube-prometheus-stack
Prometheus Operater 定义了如下的几类自定义资源:
- AlertmanagerConfig
- Alertmanager
- PodMonitor
- Probe
- Prometheus
- PrometheusRule
- ServiceMonitor
- ThanosRuler
Prometheus
该 CRD 声明定义了 Prometheus 期望在 Kubernetes 集群中运行的配置,提供了配置选项来配置副本、持久化、报警实例等。
对于每个 Prometheus CRD 资源,Operator 都会以 StatefulSet 形式在相同的命名空间下部署对应配置的资源,Prometheus Pod 的配置是通过一个包含 Prometheus 配置的名为 <prometheus-name> 的 Secret 对象声明挂载的。
该 CRD 根据标签选择来指定部署的 Prometheus 实例应该覆盖哪些 ServiceMonitors,然后 Operator 会根据包含的 ServiceMonitors 生成配置,并在包含配置的 Secret 中进行更新。
如果未提供对 ServiceMonitor 的选择,则 Operator 会将 Secret 的管理留给用户,这样就可以提供自定义配置,同时还能享受 Operator 管理 Operator 的设置能力。
一个样例配置如下:
1 | apiVersion: monitoring.coreos.com/v1 |
Alertmanager
该 CRD 定义了在 Kubernetes 集群中运行的 Alertmanager 的配置,同样提供了多种配置,包括持久化存储。
对于每个 Alertmanager 资源,Operator 都会在相同的命名空间中部署一个对应配置的 StatefulSet,Alertmanager Pods 被配置为包含一个名为 <alertmanager-name> 的 Secret,该 Secret 以 alertmanager.yaml 为 key 的方式保存使用的配置文件。
当有两个或更多配置的副本时,Operator 会在高可用模式下运行 Alertmanager 实例。
一个样例配置如下:
1 | apiVersion: monitoring.coreos.com/v1 |
PrometheusRule
用于配置 Prometheus 的 Rule 规则文件,包括 recording rules 和 alerting rules,可以自动被 Prometheus 加载。
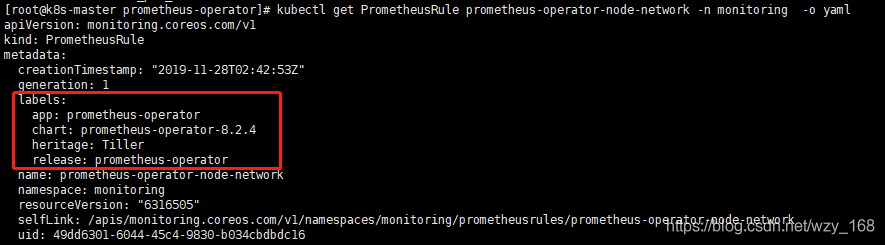
为什么Prometheus为什么会识别这个资源对象呢?
简单来说,类似标签选择器,定义的PrometheusRule资源对象,需要带有一些Labels,具体哪些可以参考默认生成的PrometheusRule,然后新建的也给加上。
所有的Rules都有对应的文件,默认生成在prometheus容器内的
2
>
>
目录下,新增一个PrometheusRule资源,也会在该目录下自动生成一个YAML文件。
因此我们可以不用管理配置文件,只需要管理PrometheusRule,prometheus-operator使得prometheus监控更加K8s
可以用命令查看你创建的所有规则:
2
>
一个样例配置如下:
1 | apiVersion: monitoring.coreos.com/v1 |
ServiceMonitor
该 CRD 定义了如何监控一组动态的服务,使用标签选择来定义哪些 Service 被选择进行监控。这可以让团队制定一个如何暴露监控指标的规范,然后按照这些规范自动发现新的服务,而无需重新配置。
为了让 Prometheus 监控 Kubernetes 内的任何应用,需要存在一个 Endpoints 对象,Endpoints 对象本质上是IP地址的列表,通常 Endpoints 对象是由 Service 对象来自动填充的,Service 对象通过标签选择器匹配 Pod,并将其添加到Endpoints 对象中。一个 Service 可以暴露一个或多个端口,这些端口由多个 Endpoints 列表支持,这些端点一般情况下都是指向一个 Pod。
Prometheus Operator 引入的这个 ServiceMonitor 对象就会发现这些 Endpoints 对象,并配置 Prometheus 监控这些 Pod。ServiceMonitorSpec 的 endpoints 部分就是用于配置这些 Endpoints 的哪些端口将被 scrape 指标的。
注意:
endpoints(小写)是ServiceMonitor CRD中的字段,而Endpoints(大写)是Kubernetes的一种对象。
ServiceMonitors 以及被发现的目标都可以来自任何命名空间,这对于允许跨命名空间监控的场景非常重要。使用 PrometheusSpec 的 ServiceMonitorNamespaceSelector,可以限制各自的 Prometheus 服务器选择的 ServiceMonitors 的命名空间。使用 ServiceMonitorSpec 的 namespaceSelector,可以限制 Endpoints 对象被允许从哪些命名空间中发现,要在所有命名空间中发现目标,namespaceSelector 必须为空:
1 | spec: |
一个样例配置如下:
1 | apiVersion: monitoring.coreos.com/v1 |
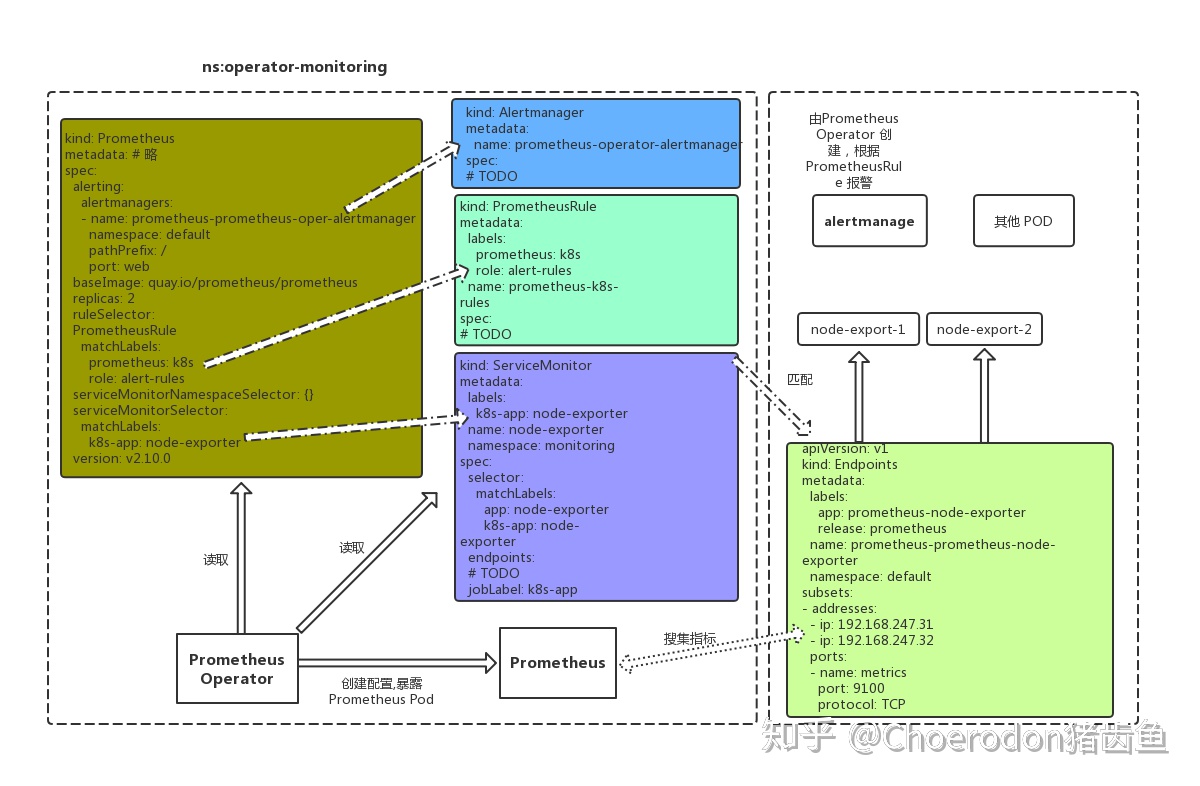
以上几种自定义资源的关系大致如下图所示:
PodMonitor
该 CRD 用于定义如何监控一组动态 pods,使用标签选择来定义哪些 pods 被选择进行监控。同样团队中可以制定一些规范来暴露监控的指标。
Pod 是一个或多个容器的集合,可以在一些端口上暴露 Prometheus 指标。
由 Prometheus Operator 引入的 PodMonitor 对象会发现这些 Pod,并为 Prometheus 服务器生成相关配置,以便监控它们。
PodMonitorSpec 中的 PodMetricsEndpoints 部分,用于配置 Pod 的哪些端口将被 scrape 指标,以及使用哪些参数。
PodMonitors 和发现的目标可以来自任何命名空间,这同样对于允许跨命名空间的监控用例是很重要的。使用 PodMonitorSpec 的 namespaceSelector,可以限制 Pod 被允许发现的命名空间,要在所有命名空间中发现目标,namespaceSelector 必须为空:
1 | spec: |
PodMonitor和ServieMonitor最大的区别就是不需要有对应的Service。
一个样例配置如下:
1 | apiVersion: monitoring.coreos.com/v1 |
ThanosRuler
该 CRD 定义了一个 Thanos Ruler 组件的配置,以方便在 Kubernetes 集群中运行。通过 Thanos Ruler,可以跨多个Prometheus 实例处理记录和警报规则。
一个 ThanosRuler 实例至少需要一个 queryEndpoint,它指向 Thanos Queriers 或 Prometheus 实例的位置。queryEndpoints 用于配置 Thanos 运行时的 --query 参数,更多信息也可以在 Thanos 文档中找到。
一个样例配置如下:
1 | apiVersion: monitoring.coreos.com/v1 |
Probe
该 CRD 用于定义如何监控一组 Ingress 和静态目标。除了 target 之外,Probe 对象还需要一个 prober,它是监控的目标并为 Prometheus 提供指标的服务。例如可以通过使用 blackbox-exporter 来提供这个服务。
一个样例配置如下:
1 | apiVersion: monitoring.coreos.com/v1 |
AlertmanagerConfig
在以前的版本中要配置 Alertmanager 都是通过 Configmap 来完成的,在 v0.43 版本后新增该 CRD,可以将 Alertmanager 的配置分割成不同的子对象进行配置,允许将报警路由到自定义 Receiver 上,并配置抑制规则。
AlertmanagerConfig 可以在命名空间级别上定义,为 Alertmanager 提供一个聚合的配置。这里提供了一个如何使用它的例子。不过需要注意这个 CRD 还不稳定。
这样我们要在集群中监控什么数据,就变成了直接去操作 Kubernetes 集群的资源对象了,是这样比之前手动的方式就方便很多了。
一个样例配置如下:
1 | apiVersion: monitoring.coreos.com/v1alpha1 |
安装 prometheus-operator
为了使用 Prometheus-Operator,这里我们直接使用 kube-prometheus 这个项目来进行安装,该项目和 Prometheus-Operator 的区别就类似于 Linux 内核和 CentOS/Ubuntu 这些发行版的关系,真正起作用的是 Operator 去实现的,而 kube-prometheus 只是利用 Operator 编写了一系列常用的监控资源清单。
首先 clone 项目代码,切换到当前最新的 v0.7.0 版本:
1 | $ git clone https://github.com/prometheus-operator/kube-prometheus.git |
首先创建需要的命名空间和 CRDs,等待它们可用后再创建其余资源:
1 | $ kubectl apply -f manifests/setup |
进入到 manifests 目录下面,首先我们需要安装 setup 目录下面的 CRD 和 Operator 资源对象,等待它们可用后再创建其余资源:
1 | $ kubectl apply -f setup/ |
这会创建一个名为 monitoring 的命名空间,以及相关的 CRD 资源对象声明和 Prometheus Operator 控制器。前面章节中我们讲解过 CRD 和 Operator 的使用,当我们声明完 CRD 过后,就可以来自定义资源清单了,但是要让我们声明的自定义资源对象生效就需要安装对应的 Operator 控制器,这里我们都已经安装了,所以接下来就可以来用 CRD 创建真正的自定义资源对象了。在 manifests 目录下面的就是我们要去创建的 Prometheus、Alertmanager 以及各种监控对象的资源清单,直接安装即可:
1 | $ kubectl apply -f manifests/ |
这会自动安装 node-exporter、kube-state-metrics、grafana、prometheus-adapter 以及 prometheus 和 alertmanager 等大量组件,而且 prometheus 和 alertmanager 还是多副本的。
- 使用grafana实现数据可视化
- 使用alertmanager实现监控报警
- 使用node_exporter收集集群中各节点的数据
- 使用kube-state-metrics收集k8s集群内资源对象数据
- 使用prometheus收集apiserver,scheduler,controller-manager,kubelet组件数据
提下 kube-state-metrics:
kube-state-metrics is a simple service that listens to the Kubernetes API server and generates metrics about the state of the objects. (See examples in the Metrics section below.) It is not focused on the health of the individual Kubernetes components, but rather on the health of the various objects inside, such as deployments, nodes and pods.
上面是官方的解释,大概就是这个服务采集的k8s集群内部的各个对象的数据。包括 deployments,sts等。
一个样例采集结果如下:
2
3
4
> kube_state_metrics_list_total{resource="*v1.Node",result="error"} 52
> kube_state_metrics_watch_total{resource="*v1beta1.Ingress",result="success"} 1
>
>
kube-state-metrics 也可以采集 http request metrics,样例如下:
2
3
4
5
6
7
> http_request_duration_seconds_bucket{handler="metrics",method="get",le="5"} 30
> http_request_duration_seconds_bucket{handler="metrics",method="get",le="10"} 30
> http_request_duration_seconds_bucket{handler="metrics",method="get",le="+Inf"} 30
> http_request_duration_seconds_sum{handler="metrics",method="get"} 0.021113919999999998
> http_request_duration_seconds_count{handler="metrics",method="get"} 30
>
>
kube-state-metrics also exposes build and configuration metrics:
2
3
4
> kube_state_metrics_shard_ordinal{shard_ordinal="0"} 0
> kube_state_metrics_total_shards 1
>
>
kube_state_metrics_build_infois used to expose version and other build information. For more usage about the info pattern, please check the blog post here. Sharding metrics expose--shardand--total-shardsflags and can be used to validate run-time configuration, see/examples/prometheus-alerting-rules.
1 | $ kubectl get pods -n monitoring |
可以看到上面针对 grafana、alertmanager 和 prometheus 都创建了一个类型为 ClusterIP 的 Service,当然如果我们想要在外网访问这两个服务的话可以通过创建对应的 Ingress 对象或者使用 NodePort 类型的 Service,我们这里为了简单,直接使用 NodePort 类型的服务即可,编辑 grafana、alertmanager-main 和 prometheus-k8s 这3个 Service,将服务类型更改为 NodePort:
1 | # 将 type: ClusterIP 更改为 type: NodePort |
更改完成后,我们就可以通过上面的 NodePort 去访问对应的服务了,比如查看 prometheus 的服务发现页面:
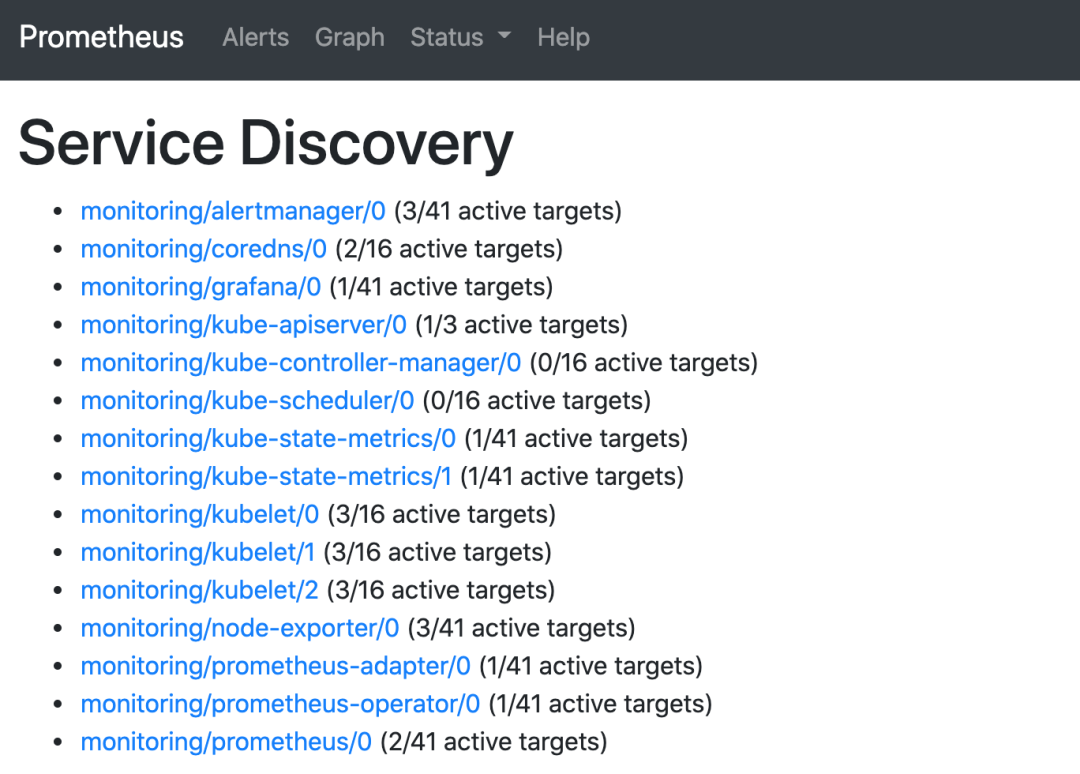
可以看到已经监控上了很多指标数据了,上面我们可以看到 Prometheus 是两个副本,我们这里通过 Service 去访问,按正常来说请求是会去轮询访问后端的两个 Prometheus 实例的,但实际上我们这里访问的时候始终是路由到后端的一个实例上去,因为这里的 Service 在创建的时候添加了 sessionAffinity: ClientIP 这样的属性,会根据 ClientIP 来做 session 亲和性,所以我们不用担心请求会到不同的副本上去:
1 | apiVersion: v1 |
为什么会担心请求会到不同的副本上去呢?正常多副本应该是看成高可用的常用方案,理论上来说不同副本本地的数据是一致的,但是需要注意的是 Prometheus 的主动 Pull 拉取监控指标的方式,由于抓取时间不能完全一致,即使一致也不一定就能保证网络没什么问题,所以最终不同副本下存储的数据很大可能是不一样的,所以这里我们配置了 session 亲和性,可以保证我们在访问数据的时候始终是一致的。
我们可以看到上面的监控指标大部分的配置都是正常的,只有两三个没有管理到对应的监控目标,比如 kube-controller-manager 和 kube-scheduler 这两个系统组件。
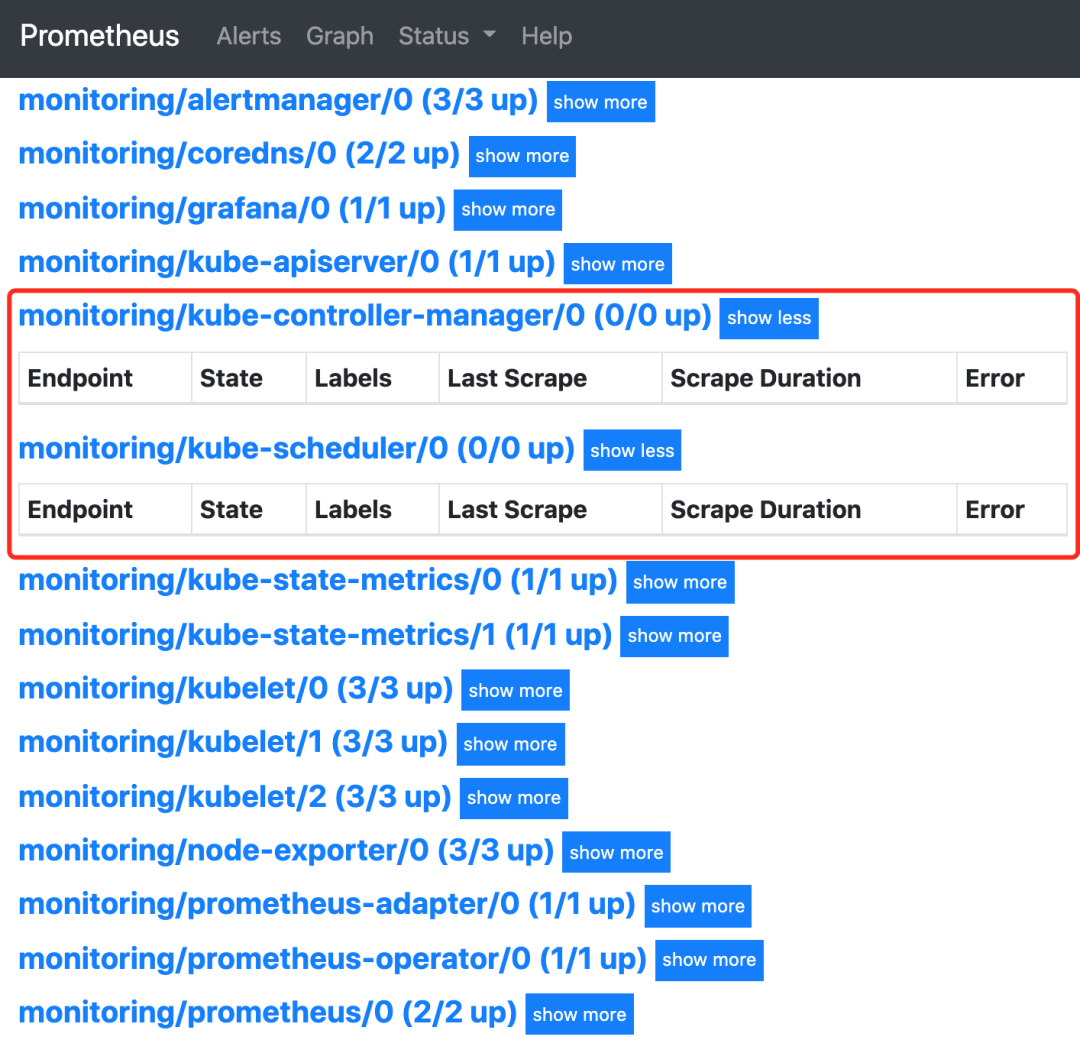
这其实就和 ServiceMonitor 的定义有关系了,我们先来查看下 kube-scheduler 组件对应的 ServiceMonitor 资源的定义:
1 | # manifests/prometheus-serviceMonitorKubeScheduler.yaml |
上面是一个典型的 ServiceMonitor 资源对象的声明方式,上面我们通过 selector.matchLabels 在 kube-system 这个命名空间下面匹配具有 k8s-app=kube-scheduler 这样的 Service,但是我们系统中根本就没有对应的 Service:
1 | $ kubectl get svc -n kube-system -l k8s-app=kube-scheduler |
所以我们需要去创建一个对应的 Service 对象,才能与 ServiceMonitor 进行关联:
1 | # prometheus-kubeSchedulerService.yaml |
其中最重要的是上面 labels 和 selector 部分,labels 区域的配置必须和我们上面的 ServiceMonitor 对象中的 selector 保持一致,selector 下面配置的是 component=kube-scheduler,为什么会是这个 label 标签呢,我们可以去 describe 下 kube-scheduler 这个 Pod:
1 | $ kubectl describe pod kube-scheduler-master1 -n kube-system |
我们可以看到这个 Pod 具有 component=kube-scheduler 和 tier=control-plane 这两个标签,而前面这个标签具有更唯一的特性,所以使用前面这个标签较好,这样上面创建的 Service 就可以和我们的 Pod 进行关联了,直接创建即可:
1 | $ kubectl apply -f prometheus-kubeSchedulerService.yaml |
创建完成后,隔一小会儿后去 Prometheus 页面上查看 targets 下面 kube-scheduler 已经有采集的目标了,但是报了 connect: connection refused 这样的错误:
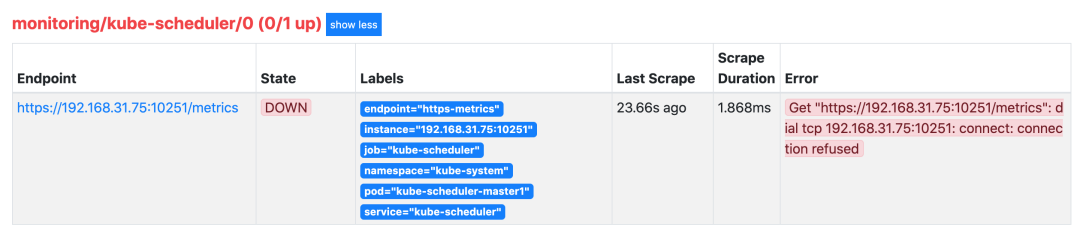
这是因为 kube-scheduler 启动的时候默认绑定的是 127.0.0.1 地址,所以要通过 IP 地址去访问就被拒绝了,我们可以查看 master 节点上的静态 Pod 资源清单来确认这一点:
1 | # /etc/kubernetes/manifests/kube-scheduler.yaml |
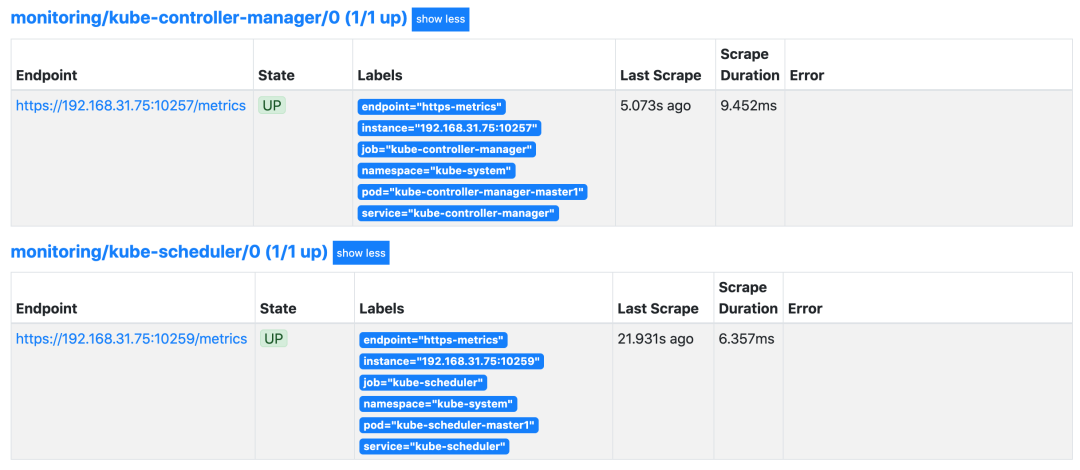
我们可以直接将上面的 --bind-address=127.0.0.1 更改为 --bind-address=0.0.0.0 即可,更改后 kube-scheduler 会自动重启,重启完成后再去查看 Prometheus 上面的采集目标就正常了。
可以用同样的方式来修复下 kube-controller-manager 组件的监控,创建一个如下所示的 Service 对象,只是端口改成 10257:
1 | # prometheus-kubeControllerManagerService.yaml |
然后将 kube-controller-manager 静态 Pod 的资源清单文件中的参数 --bind-address=127.0.0.1 更改为 --bind-address=0.0.0.0。
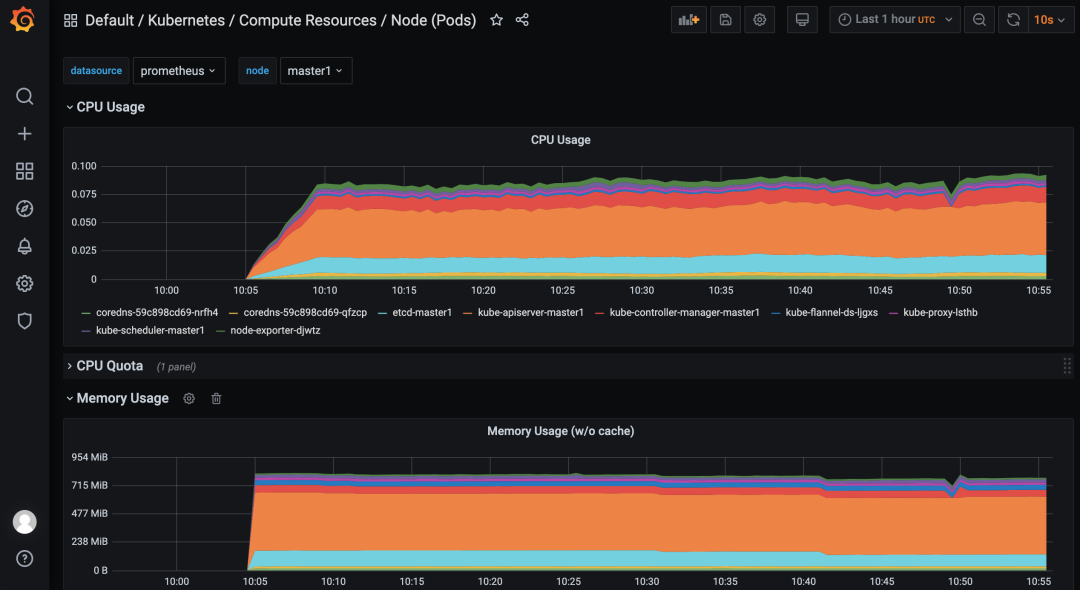
上面的监控数据配置完成后,我们就可以去查看下 Grafana 下面的监控图表了,同样使用上面的 NodePort 访问即可,第一次登录使用 admin:admin 登录即可,进入首页后,我们可以发现其实 Grafana 已经有很多配置好的监控图表了。
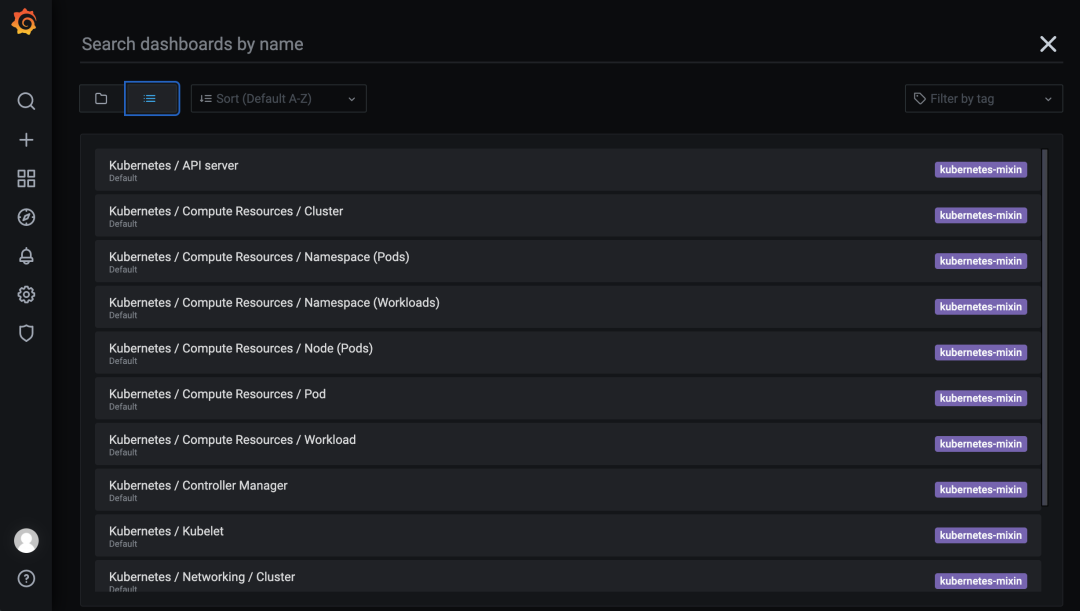
我们可以随便选择一个 Dashboard 查看监控图表信息。
参考:
全手动部署prometheus-operator监控K8S集群以及一些坑