我们每个人的心中,都有两只老虎。第一只老虎,是善的,它大方、善良、慈悲;第二只老虎,是恶的,它狭隘、邪恶、自私。而且,这两只老虎每天都在我们的心里打架……
监控系统的扩展性和高可用性绝大部分是由存储决定的。比如著名的zabbix是支持Es做为后端存储的,这就解决了数据可靠性和存储的扩展。而PrometheUS默认是本地存储在tsdb上,如果考虑存储大量的sample,可以考虑remote storage。
Local storage 简述
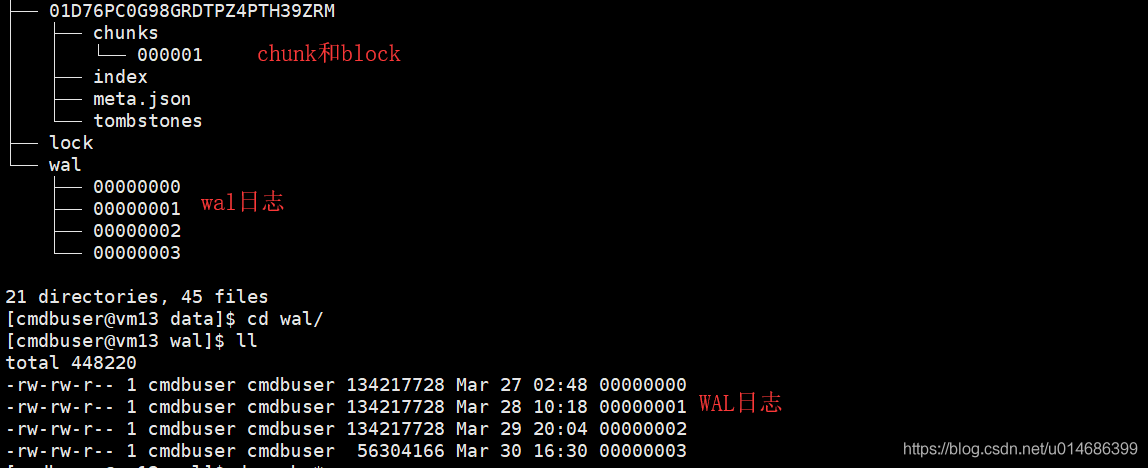
本地存储的最小单位是block,每个block是最近两个小时的数据。block里面是多个chunk。chunk里面存储的就是sample。此外block里面还有index,用于索引chunk里面的数据,用于快速查找;还有metadata,用于记录block的元数据(存储的数据的开始时间以及结束时间等);还有一个tombstones文件,用于标记那些sample已经删除了,这里只是标记不是删除。
本地存储中还有个WAL日志文件(预写日志)。prometheus抓取的数据不会立即刷盘,而是放在内存中。想象一下如果这时候宕机了,数据岂不丢了。wal日志的作用就是防止这个的。wal日志128M作为一个片段,最少也得有三个片段,这个是硬性规定。因为block里面存储的数据是压缩过的,而wal里面的数据是未压缩的,所以wal日志会比block大。在监控项比较多的prometheus上,会看到多于三个片段,这个是正常的,因为WAL日志中最小也要存储两个小时的数据。
我说的可能不清楚,如果想详细了解TSDB,可以去GitHub上看:https://github.com/prometheus/tsdb/blob/master/docs/format/README.md
- 设置
1 | --storage.tsdb.path 存储位置,默认是data目录 |
官方说我们再算存储的时候,每个sample值就按1~2bytes算,那么我们需要的总存储就是:
needed_disk_space = retention_time_seconds * ingested_samples_per_second * bytes_per_sample
ingested_samples_per_second 是每秒抽取多少个指标。bytes_per_sample是每个指标的值的大小,如果指标的数据类型特别多,我觉得可以按照1~2bytes算,如果指标的数据类型比较单一,我觉得你应该自己评估这个值。
remote storage简介
对于业务比较大的环境Local storage是绝对满足不了的,那么就要用remote storage了。
- prometheus的remote storage需要借助adapter实现。adapter会提供write url和read url给prometheus,这样prometheus获取到数据后就会先写到本地然后再调用write url写到远端。读数据我理解的不好,这里就不多说,据说remote read 对PromQL 支持不好。不是所有的adapter都提供read url的。

prometheus调用adapter都是HTTP结合snappy。在不远的将来可能就是 grpc结合HTTP/2了
现在prometheus官方和社区整合很多remote storage的adapter,如下图,不只有这些还有clickhouse等,大家可以网上百度去,也可以自行开发:
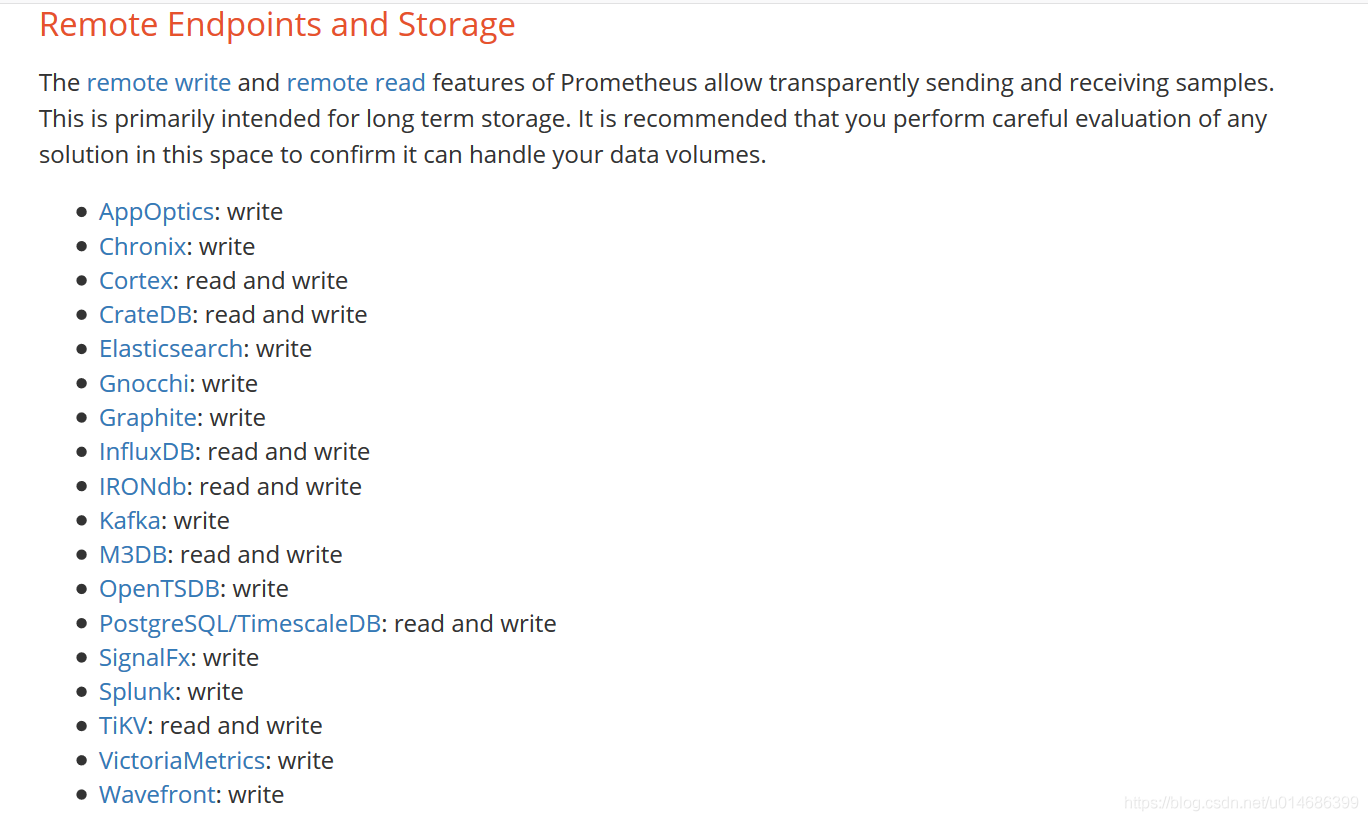
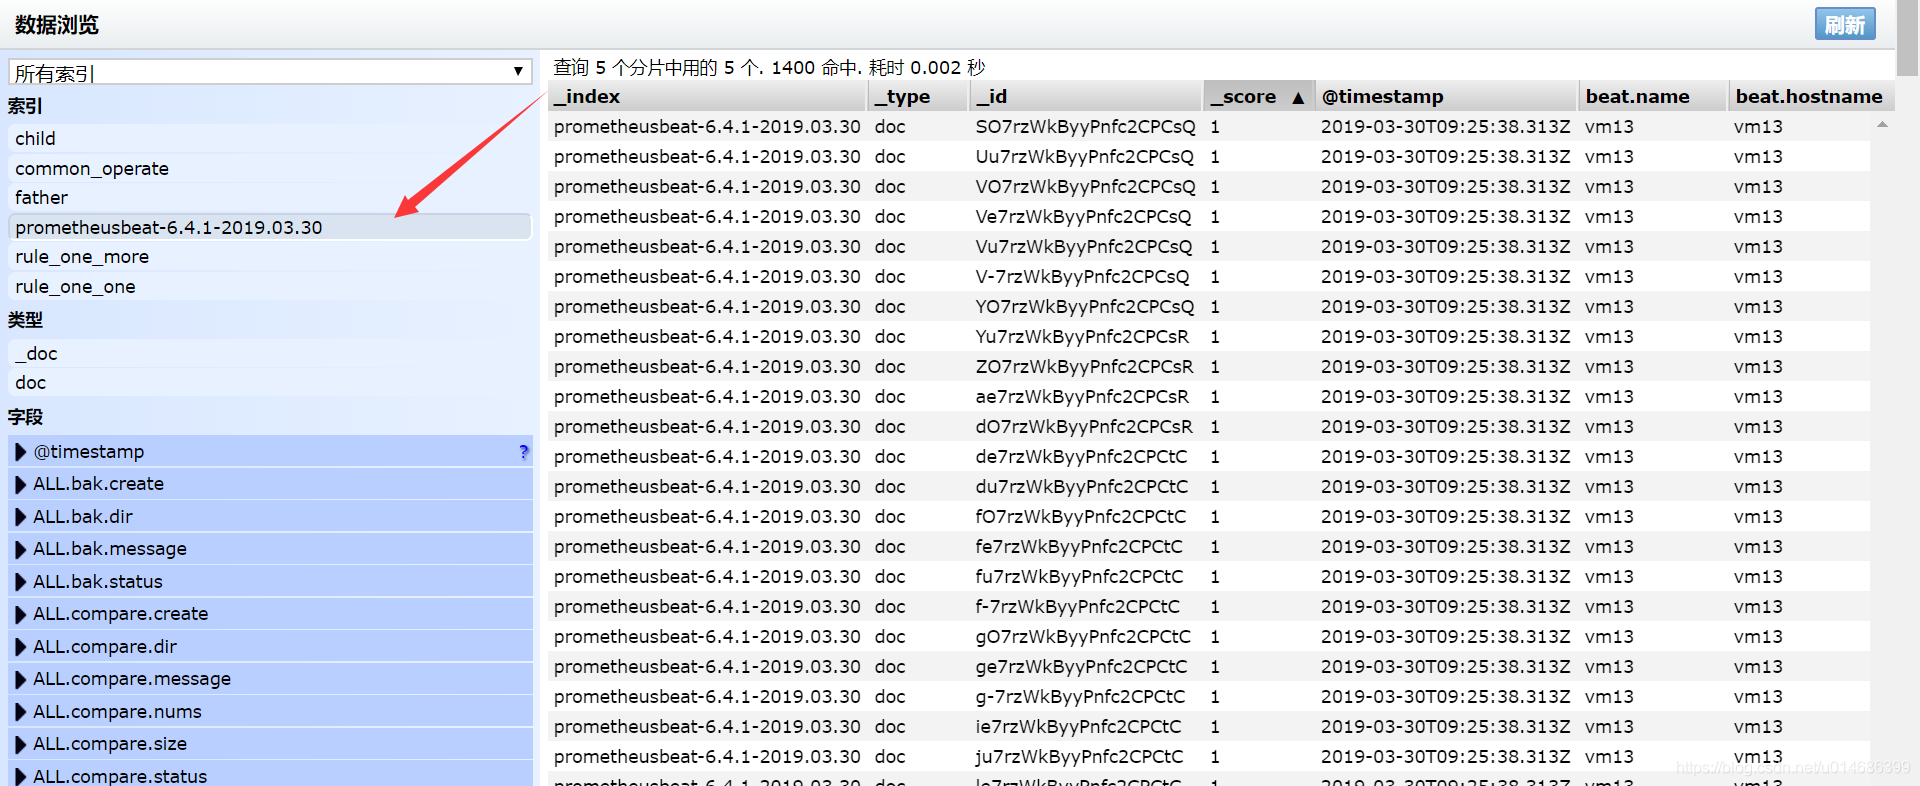
remote storage to Elasticsearch
由于我知识比较贫穷,就了解个Elasticsearch,所以这里就用Elasticsearch做实验了,在上图可以看到,prometheus只能写到Elasticsearch。
准备prometheusbeat
https://github.com/infonova/prometheusbeat 这个是他的github地址。如果懒得编译可以去QQ群里下载,QQ群的地址在最下面。
配置prometheusbeat
设置监听端口
1 | prometheusbeat: |
- 设置ES的地址
1 | #-------------------------- Elasticsearch output ------------------------------ |
- 启动
1 | #这个正常情况下应该后台启动的 |
- 配置prometheus
1 | remote_write: |
重新加载配置或者重启
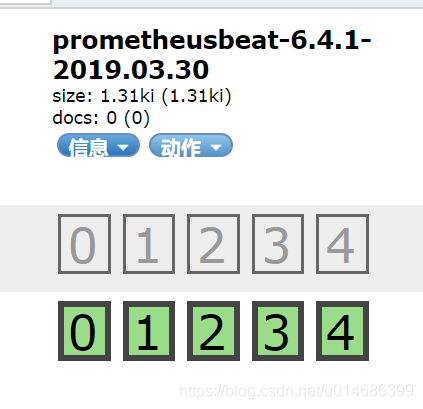
静静的过一小会儿,查看ES